Advanced Spectrum Generation
In addition to generating a basic spectrum as demonstrated in the annotated example, the user can also customize the generated spectrum in a variety of ways. One can choose which spectral lines to deposit or choose different settings for the characteristics of the spectrograph, and more. The following code goes through the process of setting these properties and shows what impact it has on resulting spectra.
For this demonstation, we’ll be using a light ray passing through a very dense
disk of gas, taken from the initial output from the AGORA isolated box
simulation using ART-II in Kim et al. (2016).
If you’d like to try to reproduce the spectra included below you can get
the LightRay file from the Trident sample data using the
command:
$ wget http://trident-project.org/data/sample_data/ART-II_ray.h5
Now, we’ll load up the ray using yt:
import yt
import trident
ray = yt.load('ART-II_ray.h5')
Setting the spectrograph
Let’s set the characteristics of the spectrograph we will use to create this spectrum. We can either choose the wavelength range and resolution and line spread function explicitly, or we can choose one of the preset instruments that come with Trident. To list the presets and their respective values, use this command:
print(trident.valid_instruments)
Currently, we have three settings for the Cosmic Origins Spectrograph available:
COS-G130M, COS-G140L, and COS-G160M, but we plan to add more
instruments soon. To use one of them, we just use the name string in the
SpectrumGenerator class:
sg = trident.SpectrumGenerator('COS-G130M')
But instead, let’s just set our wavelength range manually from 1150 angstroms to 1250 angstroms with a resolution of 0.01 angstroms:
sg = trident.SpectrumGenerator(lambda_min=1150, lambda_max=1250, dlambda=0.01)
From here, we can pass the ray to the
SpectrumGenerator object to use in the
construction of a spectrum.
Choosing what absorption features to include
There is a LineDatabase class that controls which
spectral lines you can add to your spectrum. Trident provides you with a default
LineDatabase with 213 spectral lines commonly used
in CGM and IGM studies, but you can create your own
LineDatabase with different lines. To see a list of
all the lines included in the default line list:
ldb = trident.LineDatabase('lines.txt')
print(ldb)
which is reading lines from the ‘lines.txt’ file present in the data directory (see where is Trident installed?) We can specify any subset of these spectral lines to use when creating the spectrum from our master line list. So if you’re interested in just looking at neutral hydrogen lines in your spectrum, you can see what lines will be included with the command:
print(ldb.parse_subset('H I'))
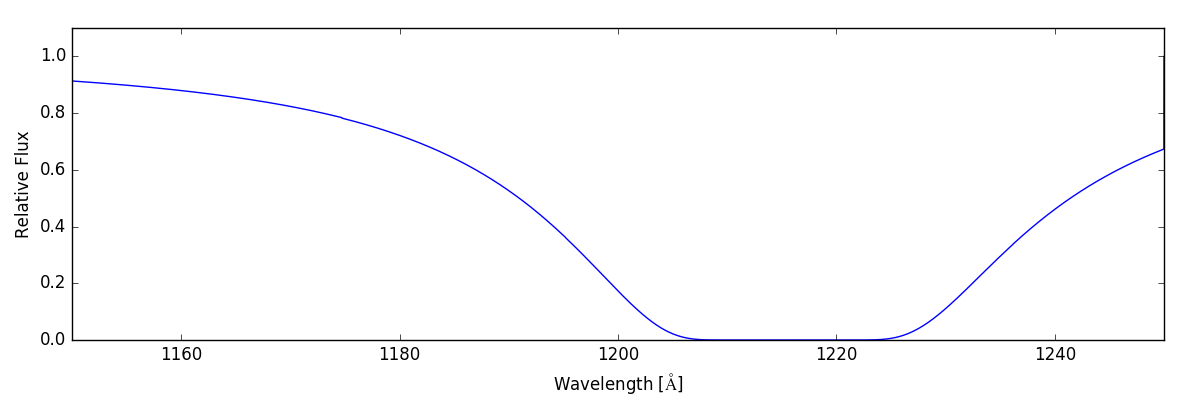
As a first pass, we’ll create a spectrum that just include lines produced by hydrogen:
sg.make_spectrum(ray, lines=['H'])
sg.plot_spectrum('spec_H.png')
The resulting spectrum contains a nice, big Lyman-alpha feature.
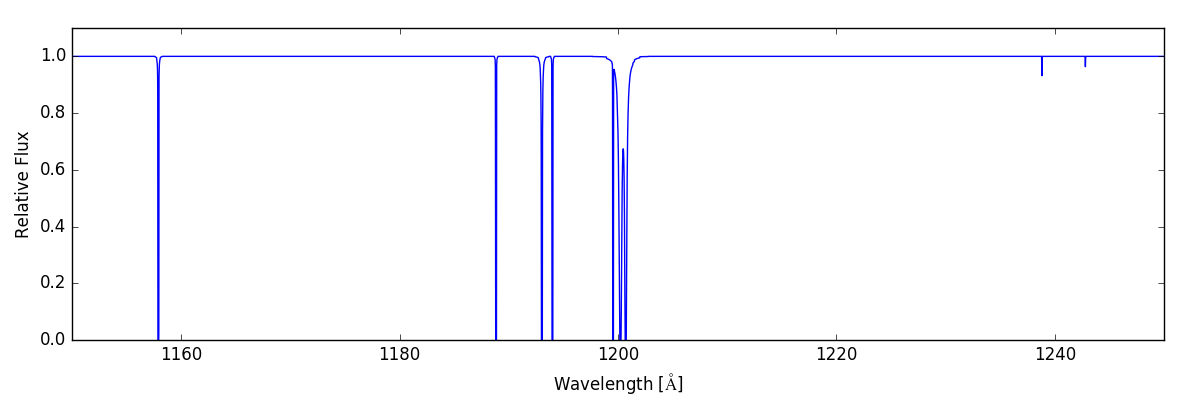
If, instead, we want to shows the lines that would be in our spectral range due to carbon, nitrogen, and oxygen, we can do the following:
sg.make_spectrum(ray, lines=['C', 'N', 'O'])
sg.plot_spectrum('spec_CNO.png')
And now we have:
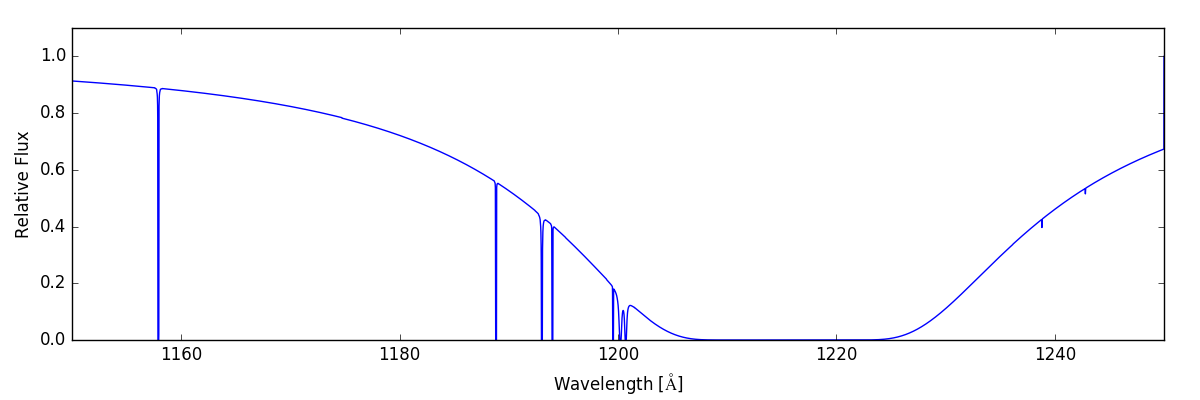
We can see how these two spectra combined when we include all of the same lines:
sg.make_spectrum(ray, lines=['H', 'C', 'N', 'O'])
sg.plot_spectrum('spec_HCNO.png')
which gives:
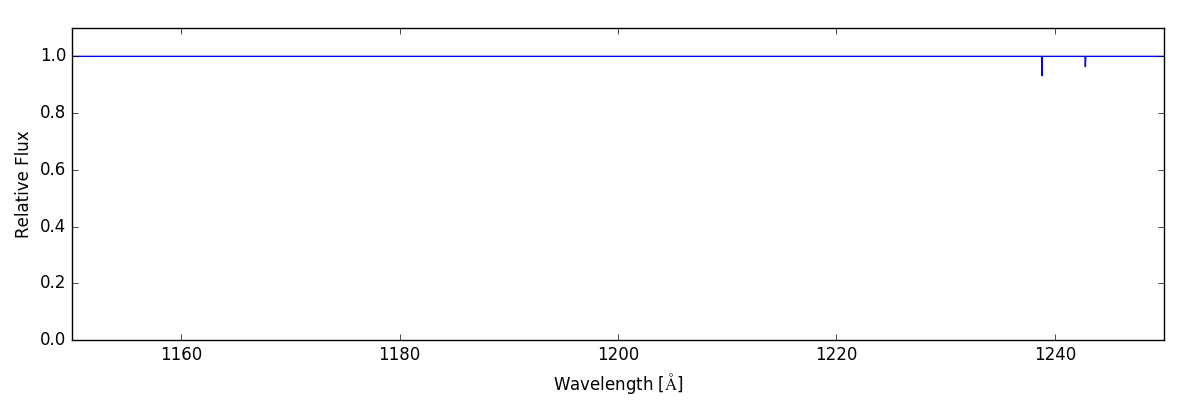
We can get even more specific, by generating a spectrum that only contains lines due to a single ion species. For example, we might just want the lines from four-times-ionized nitrogen, N V:
sg.make_spectrum(ray, lines=['N V'])
sg.plot_spectrum('spec_NV.png')
This spectrum only shows a couple of small lines on the right hand side.
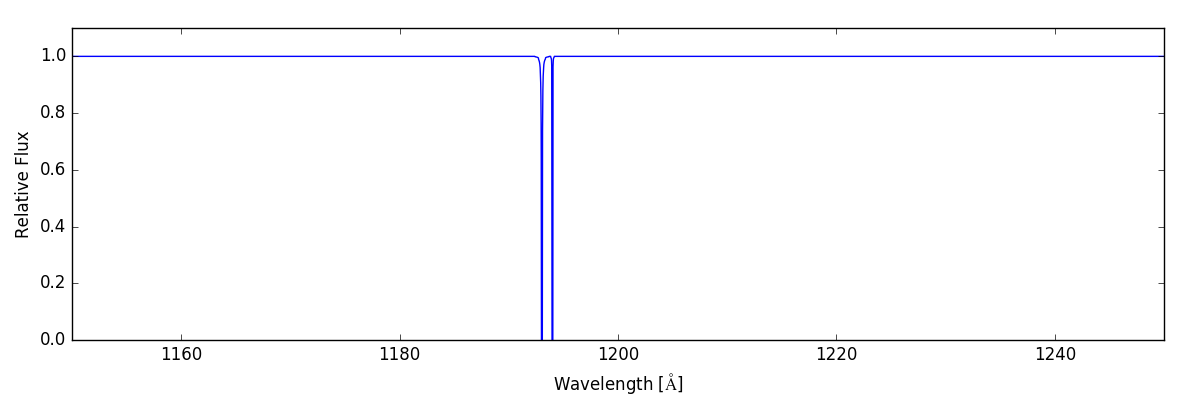
But if that level of specificity isn’t enough, we can request individual lines:
sg.make_spectrum(ray, lines=['C I 1193', 'C I 1194'])
sg.plot_spectrum('spec_CI_1193_1194.png')
And we end up with:
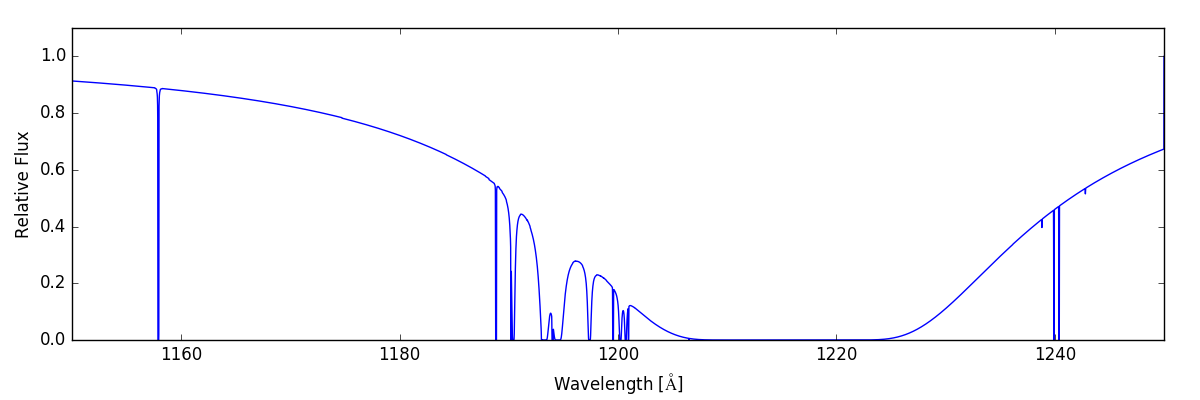
Or we can just include all of the available lines in our
LineDatabase with:
sg.make_spectrum(ray, lines='all')
sg.plot_spectrum('spec_all.png')
Giving us:
To understand how to further customize your spectra, look at the documentation
for the SpectrumGenerator and
LineDatabase classes and other
API documentation.
Setting Wavelength Bounds Automatically
If you are interested in creating a spectrum that contains all possible
absorption features for a given set of lines, the
SpectrumGenerator can be configured to
automatically enlarge the wavelength window until all absorption is captured. This is
done by setting the lambda_min and lambda_max keywords to ‘auto’
and specifying a bin size with the dlambda keyword:
sg = trident.SpectrumGenerator(lambda_min='auto', lambda_max='auto',
                               dlambda=0.01)
sg.make_spectrum("ray.h5", lines=['H I 1216'])
sg.plot_spectrum('spec_auto.png')
Note, the above example is for a different ray than is used in the previous examples. The resulting spectrum will minimally contain all absorption present in the ray. This should be used with care when depositing multiple lines as this can lead to an extremely large spectrum.
Making Spectra in Velocity Space
Trident can be configured to create spectra in velocity space instead of
wavelength space where velocity corresponds to the velocity offset from
the rest wavelength of a given line. This can be done by providing the
keyword bin_space='velocity' to the
SpectrumGenerator:
sg = trident.SpectrumGenerator(lambda_min='auto', lambda_max='auto',
                               dlambda=1., bin_space='velocity')
sg.make_spectrum("ray.h5", lines=['H I 1216'])
sg.plot_spectrum('spec_velocity.png')
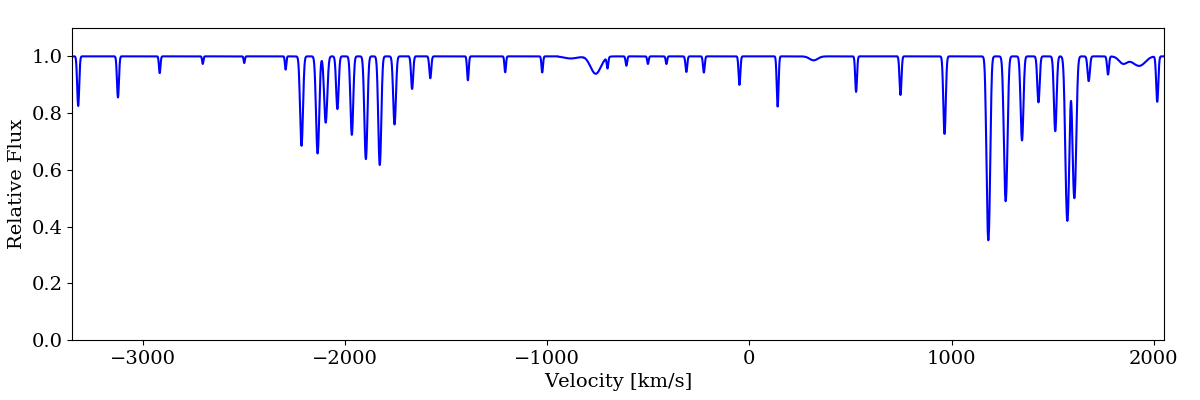
When working in velocity space, limits and bin sizes should be provided in km/s. If more than one transition is added to the spectrum (e.g., Ly-a and Ly-b), the zero point will correspond to the rest wavelength of the first transition added.
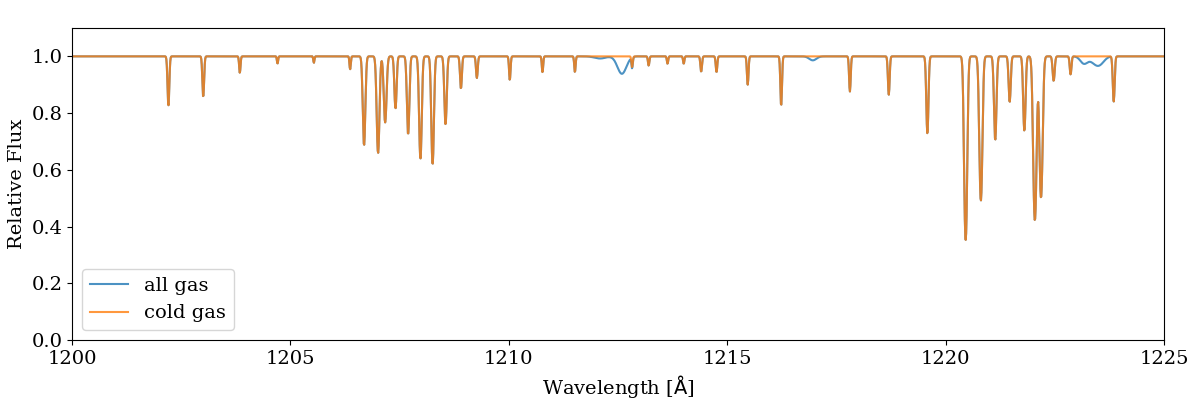
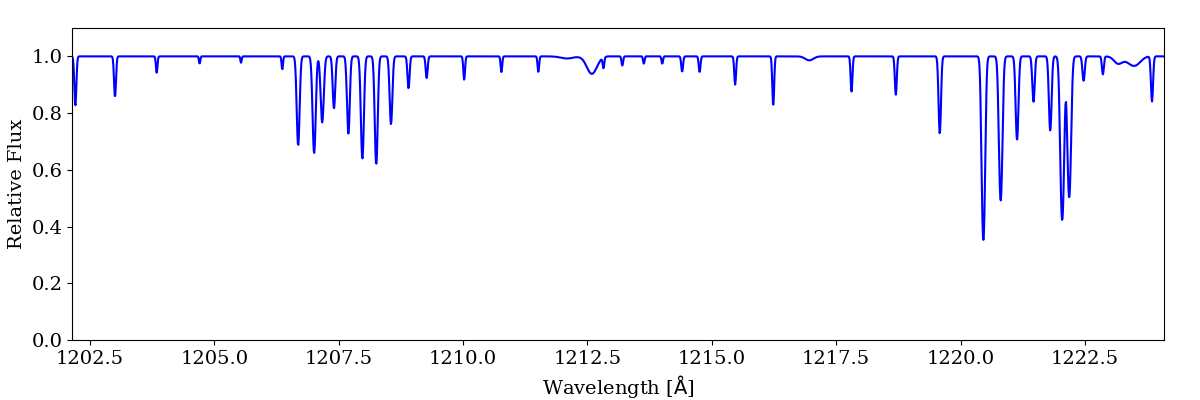
Making Spectra from a Subset of a Ray
The situation may arise where you want to see the spectrum that is generated
by only a portion of the gas along a line of sight. For example, you may want to
see the spectrum of only the cold gas. This can be done by creating a
YTCutRegion from a loaded ray
dataset:
import trident
import yt

ds = yt.load('ray.h5')
all_data = ds.all_data()
cold_gas = ds.cut_region(all_data, 'obj["gas", "temperature"] < 10000')

sg = trident.SpectrumGenerator(lambda_min=1200, lambda_max=1225,
                               dlambda=0.01)

# spectrum of entire ray
sg.make_spectrum(all_data, lines=['H I 1216'])
all_spectrum = sg.flux_field[:]

# spectrum of cold gas
sg.make_spectrum(cold_gas, lines=['H I 1216'])
cold_spectrum = sg.flux_field[:]

trident.plot_spectrum(sg.lambda_field, [all_spectrum, cold_spectrum],
                      label=['all gas', 'cold gas'], stagger=None)